
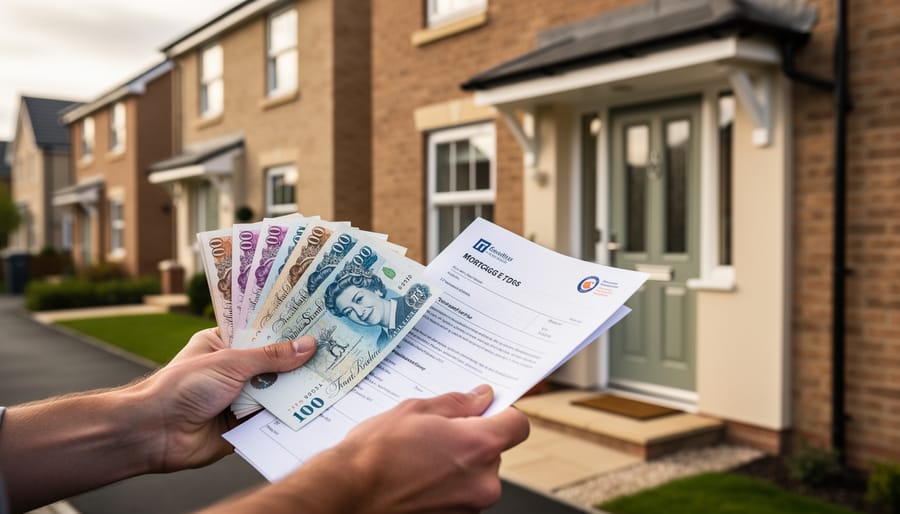
A cash offer of £240,000 often leaves sellers with more net proceeds than a financed offer of £260,000 once appraisal gaps, closing delays, and transaction costs are factored into the arithmetic. The headline price matters less than what you actually receive at closing, particularly when speed, certainty, and avoided holding costs are quantified. This comparison is essential for property sellers facing competing bids or weighing whether to sell your house for cash at a discount versus waiting for a higher financed offer.
Key Takeaway: Net proceeds trump headline price when all costs, risks, and timelines are accounted for. Cash offers eliminate appraisal risk and cut 8-12 weeks from the timeline, but sellers forfeit potential appreciation and competitive bidding. The winning choice depends on your liquidity needs, market conditions, and tolerance for deal failure.
Most sellers instinctively gravitate toward the higher number, but transaction arithmetic reveals a different story. A financed buyer introduces contingencies that erode value: mortgage approval can fall through (10-15% of contracts fail to close in typical market conditions), appraisals may come in low (forcing renegotiation or requiring the buyer to cover the gap in cash), and extended timelines impose holding costs that compound daily. Cash transactions close in 7-14 days versus 45-60 days for mortgaged sales, eliminating weeks of mortgage payments, council tax, utilities, and maintenance.
The decision framework hinges on three variables: your urgency to close, the gap between offers, and the condition of your property. Sellers with equity-rich homes in strong markets can afford to wait for top dollar. Those facing probate deadlines, chain complications, or properties requiring repairs often net more by accepting the immediate certainty of cash. Homeowners who sell your house for cash prioritise speed and certainty over maximum price, making it ideal when liquidity trumps lengthy negotiations.
Cash Offer vs. Full Price Sale: At-a-Glance

The table below summarizes the core trade-offs sellers face when comparing a cash offer to a full price financed sale. Each dimension directly affects net proceeds and transaction certainty.
| Dimension | Cash Offer | Full Price Financed Sale | Key Difference |
|---|---|---|---|
| Typical Price | 10-15% below list | At or near list price | Cash buyers demand discount for speed and certainty |
| Closing Timeline | 7-21 days | 30-60 days | Cash eliminates mortgage underwriting delay |
| Transaction Costs | Lower; fewer concessions | Higher; 2-3% seller-paid closing costs common | Financed buyers negotiate more seller contributions |
| Contingency Risk | Minimal (5% fall-through rate) | Moderate (15-20% fall-through rate) | Appraisal gaps and loan denials kill financed deals |
| Repair Credits | Often waived or minimal | $3,000-$8,000 average post-inspection | Financed buyers require property condition assurances |
| Net Proceeds Profile | Lower gross, higher net | Higher gross, lower net after costs | Time value and cost savings can offset price gap |
The arithmetic advantage of cash offers emerges most clearly in the net proceeds row. A cash offer at 88% of list price can deliver equivalent or superior net proceeds compared to a full price financed offer when you account for reduced transaction costs, eliminated holding costs during a faster close, and zero risk of deal collapse requiring a price reduction or market re-entry.
What Each Option Is

A cash offer is a proposal to purchase property without mortgage financing, meaning the buyer commits to closing with funds already in hand or readily liquidated. The buyer provides proof of funds, typically a bank statement, investment account statement, or letter from a financial institution, confirming they possess sufficient liquid assets to cover the purchase price and closing costs. Cash buyers range from individual investors with accumulated capital to institutional buyers like iBuyers, fix-and-flip companies, and real estate investment trusts. Because no lender is involved, cash transactions eliminate mortgage contingencies, appraisal requirements for loan approval, and underwriting delays.
A full price financed sale is an offer at or near the seller’s asking price where the buyer intends to obtain a mortgage loan to complete the purchase. The buyer typically puts down 3% to 20% of the purchase price and borrows the remainder from a lender. These transactions are contingent on the buyer securing final loan approval, which requires the property to appraise at or above the contract price and the buyer to satisfy underwriting conditions such as employment verification, debt-to-income ratios, and credit standards. Financed buyers are predominantly primary residence purchasers, though investors using leverage also fall into this category.
- Cash Offer
- A purchase proposal backed by liquid funds without mortgage financing, typically closing in 7-21 days with no lender contingencies.
- Full Price Sale
- A transaction at or near asking price where the buyer relies on a mortgage loan, subject to appraisal and underwriting approval over 30-60 days.
- Proof of Funds
- Documentation verifying a cash buyer has sufficient liquid assets to complete the purchase, usually a bank or brokerage statement dated within 30 days.
- Financing Contingency
- A contract clause allowing the buyer to cancel without penalty if they cannot secure mortgage approval by a specified date.
- Appraisal Contingency
- A protection allowing buyers to renegotiate or withdraw if the property appraises below the contract price, required by most lenders.
- Net Proceeds
- The actual cash a seller receives after subtracting all transaction costs, concessions, and payoffs from the gross sale price.
The structural difference matters because each contingency introduces timeline uncertainty and renegotiation risk. Financed buyers must satisfy three approval gates, initial pre-approval, property appraisal, and final underwriting, any of which can delay closing or trigger price adjustments. Cash buyers bypass these entirely, exchanging proof of funds for title at closing with minimal conditions. This fundamental difference in transaction mechanics drives the arithmetic trade-offs that follow.
The Arithmetic: Breaking Down Net Proceeds
Transaction Costs and Seller Concessions

In any real estate transaction, the gap between list price and what a seller actually receives can be substantial. Understanding these costs is essential when comparing a full-price financed offer against a lower cash bid.
Agent commissions represent the largest single expense, typically consuming 5-6% of the sale price. On a $400,000 home, that amounts to $20,000-$24,000 paid at closing and split between the listing and buyer’s agents. This cost applies regardless of whether the buyer pays cash or finances, though some cash buyers working without agents may negotiate a reduced commission.
Title and escrow fees cover the administrative work of transferring ownership and holding funds during the transaction. These combined fees generally run $1,500-$3,000 depending on property value and location, with sellers customarily paying for the owner’s title insurance policy.
Transfer taxes vary dramatically by jurisdiction. Some states charge 0.5-1% of the sale price, while others impose minimal or no transfer tax. In high-tax states like New York or Washington, this can add $4,000-$8,000 to seller costs on a mid-priced home.
Seller-paid closing costs emerge frequently in financed transactions. Buyers often negotiate for the seller to cover 2-3% of their closing costs, $6,000-$9,000 on a $300,000 purchase, to reduce cash required at closing. Cash buyers rarely request this concession.
Repair credits following inspection typically range from $3,000-$8,000, though major issues can push this higher. Cash buyers often waive inspection or accept as-is terms, eliminating this expense entirely.
On a $400,000 full-price financed offer, these costs can total $35,000-$50,000, reducing net proceeds to $350,000-$365,000 before accounting for holding costs or timing considerations.
Holding Costs and Opportunity Cost of Time
Sellers often focus on the headline price difference between a cash offer and a financed offer, but the time to close carries tangible monthly costs that can erode net proceeds. On a typical property, carrying costs run $2,000 to $4,000 per month depending on the mortgage balance, property taxes, insurance, utilities, and routine maintenance. A $400,000 mortgage at 7% interest alone costs roughly $2,330 monthly in principal and interest, before adding homeowners insurance ($150-250), property taxes ($300-600), utilities ($200-400), and basic upkeep ($100-200). Over a 30-day difference in closing timeline, these expenses accumulate to $3,000-$5,000 in direct outflows.
The opportunity cost of delayed liquidity compounds this arithmetic. In a declining market, where prices may drop 0.5% to 1.0% monthly, an extra 30 to 45 days on market exposes the seller to depreciation risk that can exceed the carrying costs. A $500,000 property losing 0.75% value monthly sheds $3,750 in equity over 30 days, stacking on top of the holding expenses. Conversely, if the seller needs proceeds to close on a replacement property or avoid bridge financing at 8% to 12% annual rates, every week of delay costs real money in financing fees or lost purchase opportunities.
| Cost Item | $500,000 Cash Offer (30 days) | $550,000 Financed Offer (60 days) |
|---|---|---|
| Gross Sale Price | $500,000 | $550,000 |
| Agent Commission (5%) | -$25,000 | -$27,500 |
| Title & Escrow Fees | -$2,000 | -$2,200 |
| Seller Concessions | $0 | -$11,000 |
| Repair Credits | $0 | -$5,000 |
| Holding Costs (30 vs. 60 days) | -$3,500 | -$7,000 |
| Net Proceeds | $469,500 | $497,300 |
When closing speed narrows from 60 days to 30 days, the seller saves one full month of carrying costs and reduces market exposure. In high-interest-rate or softening-market environments, the liquidity premium of cash can shift the break-even discount rate upward, making a 10% lower cash offer competitive with a full-price financed deal once all time-related costs are factored in. Sellers should calculate their specific monthly burn rate and price trajectory assumptions to determine the true cost of waiting.
Dimension-by-Dimension Comparison
Closing Speed and Certainty

Cash offers routinely close in 7 to 21 days, while financed transactions require 30 to 60 days from contract to settlement. This timeline difference translates directly into reduced holding costs and faster capital availability for sellers.
Beyond speed, deal certainty diverges sharply between the two structures. Cash transactions close successfully approximately 95% of the time once under contract. Financed deals, by contrast, fall through in 15 to 20% of cases. Three failure points drive this gap: appraisal shortfalls that leave buyers unable to cover the gap between contract price and appraised value, underwriting denials when lenders discover credit issues or debt-to-income problems late in the process, and buyer withdrawal when inspection findings or market shifts trigger second thoughts during the extended closing window.
For sellers facing time constraints or needing proceeds certainty to fund a replacement purchase, this reliability premium often justifies accepting a lower cash price. A financed deal that collapses after 45 days costs a seller two months of carrying expenses plus the opportunity cost of relisting in a potentially weakened market.
Appraisal Risk and Price Adjustments
Financed offers hinge on the property appraising at or above the agreed sale price. Lenders won’t fund a loan that exceeds the appraised value, leaving three outcomes when the appraisal falls short: the buyer covers the gap in cash, the seller reduces the price, or the deal collapses. In volatile markets, 10-15% of financed transactions encounter appraisal gaps, triggering renegotiation that can shave $5,000 to $20,000 off the contract price or delay closing by two to three weeks while parties haggle.
Consider a $400,000 offer with a $320,000 loan. If the appraisal returns $380,000, the lender caps the loan at $304,000. The buyer must find an extra $16,000 or the seller accepts $380,000, erasing $20,000 in expected proceeds. Buyers facing this shortfall often walk, especially first-time purchasers with limited reserves.
Cash offers sidestep appraisal risk entirely. No lender means no valuation hurdle, no last-minute price cuts, and no uncertainty about whether the deal will close at the negotiated figure. For sellers prioritizing certainty over headline price, this assurance carries measurable value.
Inspection Contingencies and Repair Credits
Financed buyers routinely include inspection contingencies in their offers, giving them a window to hire a professional inspector and then negotiate repairs or credits based on the findings. Industry data shows that roughly 70% of financed transactions trigger some form of post-inspection negotiation, with repair credits averaging $3,000 to $8,000 depending on property age and condition. These credits either reduce the final sale price or appear as seller-paid line items at closing, directly lowering your net proceeds. In tight markets or with older homes, repair requests can exceed $10,000, and some buyers will walk if you refuse major concessions.
Cash buyers, by contrast, often waive the inspection contingency altogether or agree to purchase the property as-is. This doesn’t mean they skip due diligence, many still conduct inspections for their own planning, but they contractually forfeit the right to renegotiate price or demand credits. The result is a cleaner close with no eleventh-hour surprises. Even when a cash buyer does inspect, the absence of lender-required repairs means you face fewer mandatory fixes and lower negotiation leverage on their side. This certainty translates to thousands saved and eliminates the risk of a deal falling apart ten days before closing over a faulty water heater or roof concern.
Buyer Financing Costs Passed to Seller
In financed transactions, sellers often absorb costs that never appear in cash deals. Buyer closing costs, typically 1-3% of the purchase price, are a common concession, adding $3,000, $9,000 on a $300,000 sale. Sellers may also pay discount points (0.5-1% per point) to buy down the buyer’s interest rate, or contribute to lender fees and prepaid escrow items. On higher-tier properties, these concessions scale proportionally: a $600,000 financed sale might involve $6,000, $18,000 in buyer-side costs. Cash offers eliminate this line item entirely. When modeling net proceeds, subtract these concessions from the financed offer’s headline price to reveal the true comparison. A $310,000 financed offer requiring $9,300 in seller-paid costs nets $300,700, potentially less than a $295,000 all-cash bid with zero concessions.
Market Timing and Price Trajectory Risk
The arithmetic shifts substantially depending on whether your local market is appreciating, declining, or flat. In a declining market falling 0.5-1% monthly, the 30-45 day time advantage of a cash close directly protects equity. A financed sale closing 45 days later surrenders 0.75-2.25% of property value to market depreciation during escrow, effectively eroding the higher nominal price. If prices drop 1% monthly and your home is worth $400,000, waiting an extra 30 days costs you $4,000 in lost value, enough to offset a modest cash discount.
Conversely, in appreciating markets rising 0.5-1% monthly, the longer financed timeline can work in your favor. Your contract locks in today’s price while the market continues climbing, preserving your gain. However, this assumes the deal closes. If the buyer’s financing falls through after 30 days, you restart marketing in a potentially cooled market, losing both time and momentum. Rising rates can flip buyer enthusiasm quickly, making deal certainty more valuable than theoretical appreciation during escrow. The calculus hinges on your confidence in local price direction and the specific buyer’s financial strength.
Liquidity and Reinvestment Timing
Immediate cash access delivers tangible value beyond the transaction itself. Sellers who need to close on a replacement property within a narrow window, or who lack sufficient liquid reserves to carry two mortgages simultaneously, face bridge financing costs averaging 8-12% annually, plus origination fees of 1.5-2%. A 30-day acceleration in proceeds can eliminate a $250,000 bridge loan costing $2,500, $3,000 monthly in interest and fees. Real estate investors redeploying capital into time-sensitive opportunities, distressed properties, pre-foreclosure deals, or short-window syndications, often find that faster liquidity justifies accepting a modestly lower sale price. The ability to act on a high-return opportunity tomorrow, rather than 45 days from now, can produce returns that dwarf the discount conceded to a cash buyer today.
Tax Implications and 1031 Exchange Considerations
Cash closings offer critical timing certainty for investors executing a 1031 exchange, where strict IRS deadlines, 45 days to identify replacement property and 180 days to close, leave no room for delays. A financed sale carries appraisal, underwriting, and contingency risks that can push closing dates beyond the exchange window, potentially disqualifying tax deferral on hundreds of thousands in capital gains. While transaction structure rather than payment method determines tax treatment, the 7-21 day cash timeline versus 45-60 days for financed deals provides a buffer against missed deadlines and expensive tax consequences.
Negotiation Leverage and Offer Strength
Cash offers signal fewer obstacles and stronger commitment, giving buyers negotiating power even at lower prices. In multiple-offer scenarios, sellers often accept a $380,000 cash bid over a $400,000 financed offer to avoid appraisal gaps, financing delays, and deal collapse risk. The certainty premium matters: cash buyers eliminate 15-20% of the failure points that plague financed transactions, making their offers functionally stronger despite the headline discount. When three competing bids arrive, the all-cash offer typically rises to the top of the consideration stack regardless of absolute price, because sellers value the reduced stress, compressed timeline, and near-guaranteed close. This dynamic is most pronounced in competitive markets where sellers receive multiple offers and can afford to prioritize deal structure over maximum price.
Who Should Choose Which Option
Choosing between a cash offer and a full price financed sale depends on your specific circumstances, timeline constraints, and tolerance for transaction risk. No single answer fits every seller, the arithmetic that favors one option for a relocating executive may disadvantage an investor holding a property in an appreciating market. The decision comes down to weighing three core priorities: speed, certainty, and maximum net proceeds after all costs.
Sellers Who Should Favor Cash Offers
- Job relocations requiring a close within 30 days to avoid bridge financing or dual housing costs
- Estate settlements where heirs need liquid proceeds distributed quickly and cannot afford probate delays
- Distressed properties (deferred maintenance, title issues, non-conforming additions) that will struggle to pass lender appraisals or underwriting
- Sellers in declining markets where holding an extra 45 days erodes value by 1-2%, offsetting the cash discount
- Owners prioritizing certainty over price, those who cannot afford a deal to fall through after 30-45 days due to appraisal gaps or financing denials
If your monthly carrying costs exceed $2,500 (mortgage, insurance, utilities, maintenance) and you face a 45-day financed timeline versus a 14-day cash close, the 30-day savings alone approaches $2,500, often enough to offset a 2-3% cash discount on a $350,000 property. Factor in avoided repair credits and seller concessions, and the cash offer frequently nets more despite the lower headline price.
Sellers Who Should Favor Full Price Financed Offers
Accept financed offers when you have no time pressure, low carrying costs, and a property that will appraise cleanly. Pristine homes in stable or appreciating markets, where prices rise 0.5% monthly, can capture $1,500-$3,000 in appreciation during the extended close window on a $400,000 sale. If your carrying costs are under $1,000 monthly and you are confident the buyer’s financing will clear underwriting, the full price offer maximizes gross and net proceeds. Sellers with updated homes, clear title, and buyers pre-approved with 20% down and strong credit profiles face minimal fall-through risk, making the financed premium worth pursuing.
Sellers Who Should Run Comparative Analysis
Many sellers fall between these extremes: moderate time pressure, average property condition, and offers within 5-10% of each other. In these cases, build a side-by-side net proceeds spreadsheet. Input actual costs, agent commission, title fees, estimated repair credits from inspection (use $5,000 as a baseline for financed deals), seller concessions (2-3% of financed offers), and your monthly carrying costs. Calculate net proceeds for both scenarios at 30-day and 60-day timelines. If the cash offer nets within $3,000-$5,000 of the financed offer and closes 30 days faster, most sellers prioritizing certainty will choose cash. If the financed offer nets $8,000+ more and you can afford the extra time and contingency risk, the higher offer justifies the uncertainty.
Common Questions About Cash vs. Financed Offers
Sellers evaluating competing offers often face practical questions about verifying buyer qualifications, understanding typical discount patterns, and determining when a cash offer’s lower price still delivers better net proceeds.
How do I verify a cash buyer’s proof of funds?
Request a bank statement or brokerage account statement dated within 30 days showing liquid funds equal to or exceeding the offer price, plus closing costs. The statement should come directly from the financial institution or through your real estate attorney, not just a screenshot. Institutional cash buyers typically provide a letter from their fund or title company confirming available capital.
Do cash buyers always lowball?
Cash offers typically range from 5-15% below asking price in balanced markets, reflecting the speed, certainty, and cost savings they provide sellers. This discount is not a lowball when the net proceeds equal or exceed a full-price financed offer after accounting for concessions, holding costs, and financing risk. In competitive markets, cash buyers may offer closer to asking price to secure acceptance.
How do I calculate the break-even discount rate?
Add up all costs unique to the financed offer (agent commission, buyer closing cost concessions, expected repair credits, holding costs for the additional 30-45 days), then divide by the financed offer price. If a financed offer at 400,000 USD incurs 24,000 USD in total differential costs, a cash offer at 376,000 USD breaks even. This break-even math shows whether the cash discount is justified.
Do hybrid cash-contingent offers exist?
Some buyers present cash offers with contingencies similar to financed deals (inspection, appraisal for their own due diligence, extended close dates). These reduce the certainty advantage of true cash offers. Sellers should evaluate whether such contingencies erode the value proposition and request proof of funds to confirm the buyer can close without financing if contingencies are satisfied.
When deciding whether to counter a cash offer, model both scenarios using your actual cost estimates rather than generic percentages. Factor in your carrying costs per month, the probability of deal failure based on local market research (appraisal gap rates, average days on market for financed deals), and any opportunity cost if you need capital quickly for another transaction or to avoid bridge financing.
In markets experiencing price declines or facing interest-rate impacts on buyer demand, the certainty and speed of a cash close becomes more valuable relative to the discount. Run a sensitivity analysis showing net proceeds at different close dates and price adjustment scenarios to determine your walk-away threshold. If the cash offer nets within 2-3% of the financed offer after all adjustments, the reduced execution risk often justifies acceptance, particularly if you have time-sensitive capital needs or prefer certainty over maximizing the last dollar of theoretical proceeds.
The arithmetic of a cash offer versus a full price financed sale ultimately comes down to one figure: net proceeds after all costs, risks, and time value of money are accounted for. A headline price tells you what a buyer proposes to pay, but only a line-by-line calculation of transaction costs, holding costs, concessions, and opportunity costs reveals what you actually keep. In many scenarios, a cash offer at 10-15% below asking delivers the same or better net proceeds than a full price financed offer, particularly when you factor in seller-paid closing costs, repair credits, appraisal renegotiation risk, and the carrying costs of a longer close.
No single answer fits every seller. The optimal choice depends on your liquidity needs, market conditions, risk tolerance, and investment timeline. Build a side-by-side spreadsheet comparing both offers: itemize agent commissions, title and escrow fees, concessions, monthly holding costs, and any bridge financing or opportunity costs. Adjust for the probability of deal failure and the value of certainty. Run the numbers under different scenarios, stable pricing, declining values, and alternative reinvestment returns.
Consult a CPA or financial advisor to model tax implications, especially if you are pursuing a 1031 exchange or have capital gains considerations. A qualified advisor can quantify the after-tax impact of each offer and help you evaluate opportunity cost against your broader financial goals. The right offer is the one that maximizes your net position and aligns with your priorities, not the one with the highest contract price.




+ There are no comments
Add yours